Bar Chart Programs
A trend was born through Twitter in 2019. According to Flourish, in early February, Matt Navarra, a British digital media consultant, created a tweet emphasizing the Top 15 BEST Global Brands Ranking for the Last 19 Years. What drove this viral was the execution of the topic.

Copywriter at Harbour.Space University
A trend was born through Twitter in 2019. According to Flourish, in early February, Matt Navarra, a British digital media consultant, created a tweet emphasizing the Top 15 BEST Global Brands Ranking for the Last 19 Years. What drove this viral was the execution of the topic.
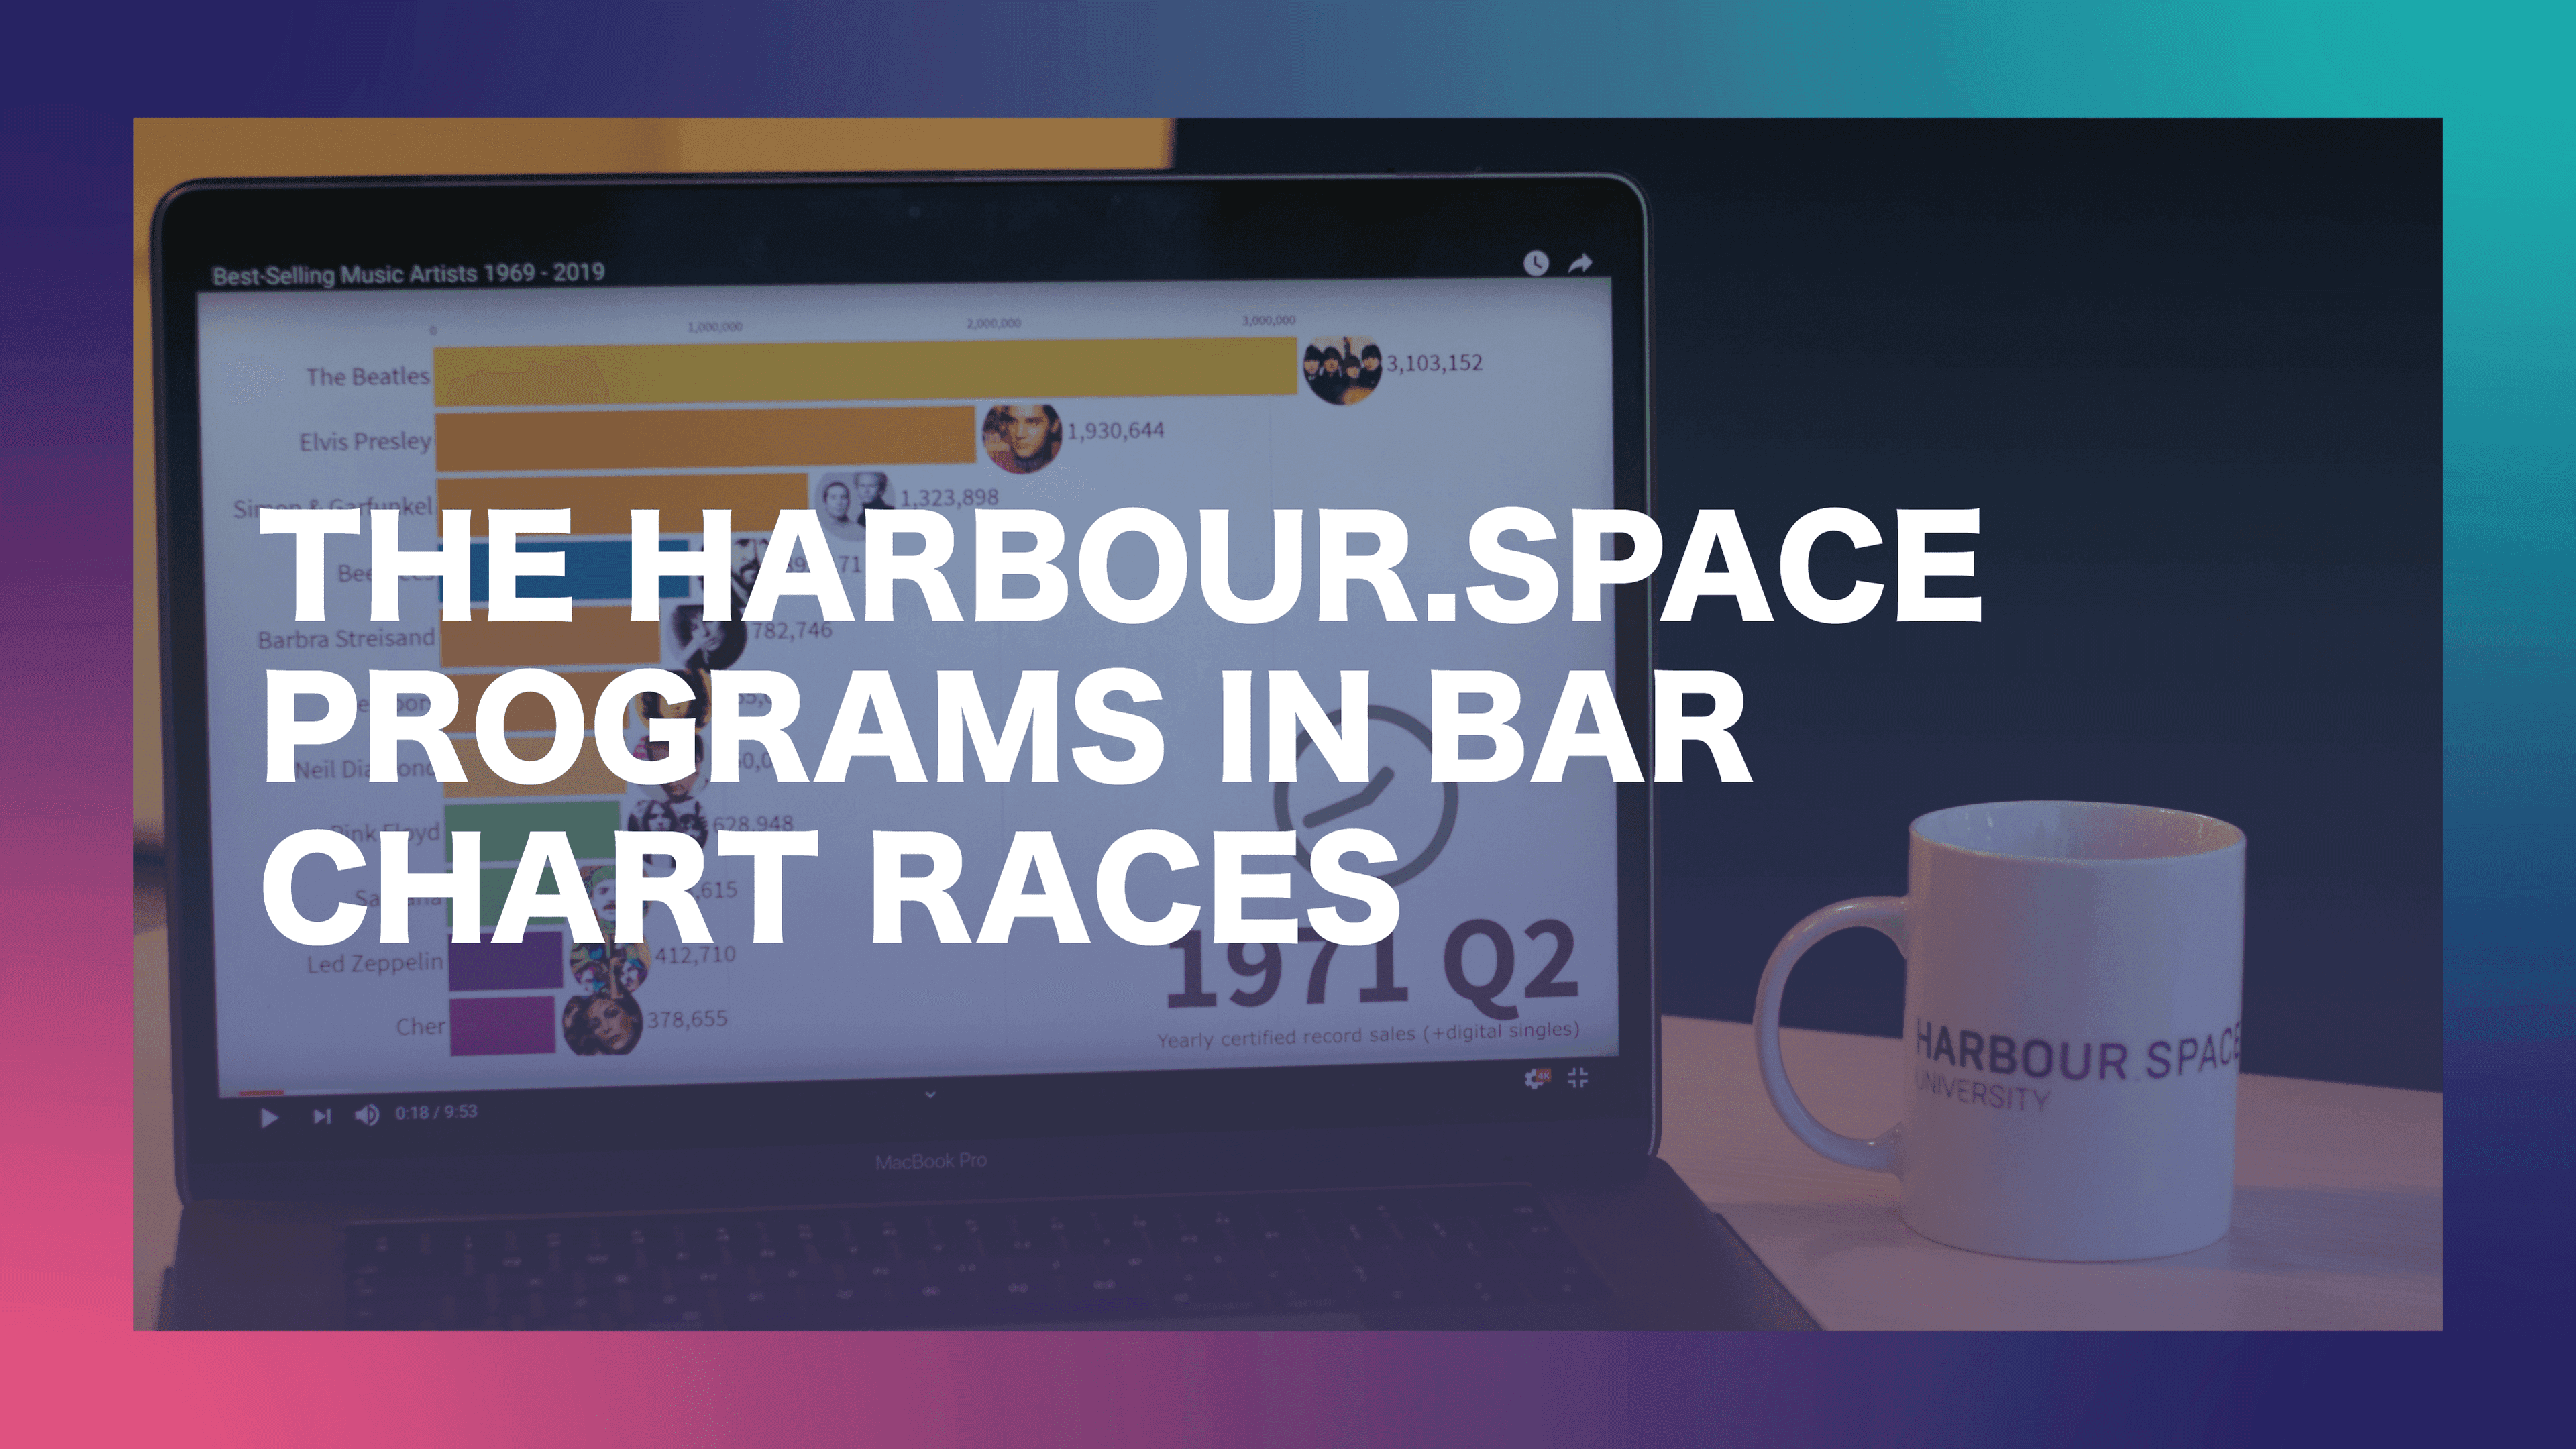
Navarra excited the Twitter platform after building up thousands of engagements with bar chart races. According to Microsoft, a bar chart race is an animated chart that helps you visualize concise data using a holistic approach. A month following Navarra’s tweet, John Burn Murdoch, a journalist at the Financial Times in London, posted his own bar racing graph. In the first comment, he released the code.
Twitter was then booming with bar chart races and held up many on Youtube watching one after another. Feeding into this trend, we are here to do the same.
Here are 10 bar racing charts, each one corresponding to one of the programs Harbour.Space University provides for its students:
Super Cities
Top Most Populated Cities (1955-2019)
Our living situation has always been parallel to the way the world is advancing. In today’s digital revolution, it's never been easier for cities to adopt big data. This is changing the way people live, work and interact with one another. It’s an entrepreneur’s territory to be a part of this disruptive environment. As Super Cities are arising, take a look at the most populated cities starting from 1955.
Fintech
Top 15 Biggest Companies by Market Capitalization (1993-2019)
The digital revolution disrupted all industries including finance. The fintech program embraced these changes and made it something of its own, as did every company still alive today. I bet you can guess what company made its way to the top in 2019. Click to find out!
Interaction Design
Most Sold Video Games of All Time (1989-2019)
When machines meet humans, it’s lifechanging. The interface design is changing for the better and we have our UX friends to thank for it. Designers put in place a renowned functionality with media creating aesthetics and automation for video games. This develops cinematic artistry for all game lovers. See for yourself what video game has acclaimed the gaming space.
Robotics
Biggest Fast Food Chains in the World (1970 - 2019)
What do you get when you combine food and robots? Remy Robotics! Remy is a robotics company at the heart of Harbour.Space’s Robotics program. They combine both food and robots with engineering to create a technology that makes cooking more efficient. This functionality will have peopling eating restaurant-quality food and the fraction of the cost. Watch below to see what fast food chains claimed the industry in 1987 and, in some cases, never left.
High-Tech Entrepreneurship
Top 10 Richest People in the World (2000-2019)
If you’re an entrepreneur, you probably possess the qualities of someone who is disciplined, confident and has strong dedication. The same qualities are present in the top 10 richest in the world. Take a look at who these people are today - will you be making the list any time soon?
Digital Marketing
Most Popular Social Networks (2003-2019)
Marketers use effective communication to link companies and the rest of the world. A communication tool Marketers use every day to channel target audiences is social media. Watch to see what social media platforms are taking the lead in 2019.
Math As a Second Language
Most Popular Operating Systems (Desktops & Laptops) 2003 - 2019
Nowadays, computers are important as they increase efficiency in our personal and professional lives. This wouldn’t be possible without knowledge of the backend software, which takes some pretty hefty math skills. Find out which popular operating system is helping us be more productive.
Computer Science
Most Popular Programming Languages on Stack Overflow
On top of digesting the disciplines of linguistics, psychology, economics and physics, computer scientists formulate cutting edge technology using a completely different language. Check out the top programming languages they use to address technical software.
Cyber Security
Best Selling Computer Brands (1996-2019)
Technology drives radical innovation in the form of new applications. Sometimes this can lead to unexpected behavior, making security a problem. These top brands would have never made a breach in the industry without the help of cybersecurity specialists. Here are the computer brands that innovated the way to the top with the help of our friends’ protection.
Data Science
Your Turn! Make your own Bar Chart Race
Data visualization is key for others to take in large amounts of complex information. Our students learn to cut through the noise and apply tools to create useful knowledge out of big data.
Hold your breath in anticipation - we are here to tell you how you can implement bar racing charts without the complexity of knowing any coding skills.
- Create an account with Flourish
- Click ‘Create New Visualization’
- Scroll to the middle of the page and choose ‘Bar Chart Race’
- Enter your personal data and preview your creation.
- Click ‘Export and Publish’ to share you big data with others in a visually compelling way!
Data is overwhelming but can be brought to life by narrowing it down and being straightforward. Not only are bar chart races mesmerizing, but they help explore big data and create key results for improvement.
If you got stuck down a rabbit trail watching all those videos, don’t feel bad. At least you learned something along the way. If you related to any of these videos, continue your education further by exploring our website.
Also, get in touch with us at hello@harbour.space to let us know how we can help fuel your imagination to help you bring big data to life.
Thanks for reading
If you’re interested in further growth, take a look at our website to learn what your future could look like at Harbour.Space. Lastly, get in touch with us at hello@harbour.space to let us know your thoughts!